Saving For Retirement — As Simple As Counting in Days

A few years ago, I wrote a post about the problems with saying “I’ll be ready in 5 minutes.” It turns out, there’s now research that — in a way — supports the point I was trying to make.

In this study, the researchers attempted to draw closer the connection between our present selves and our future selves. In particular, they looked at how manipulating the unit used to convey time (days, months, and years) can have an effect on that connection between our present selves and future selves. In plain language, consider the time between now and when you retire. It may be, what, 30, 20, 15, or 10 years away? For those of you closer to 25 years from retirement, that might sound like a long ways away (actually, it’s really not). Have you started saving for retirement? Oh, right, retirement savings, yeah, I’ll start next year.

That attitude right there, the attitude that our “future selves” are far away (when in actuality, they’re not), that’s what the researchers were targeting. From the researchers [Emphasis Added]:

We found that people say they will start saving four times sooner if told how many days rather than how many years they have until their child goes to college or until they want to retire. […] Considering one’s retirement or one’s child’s college education in days rather than years leads people to experience more connection between their present and future selves, which makes the identities linked to these future selves (e.g., “retiree”) feel more congruent with their current self. This reduces the extent that people discount future over current rewards. Less discounting means that saving for the future may feel less painful.

So, when we think about future events in a unit that is more relevant to us (days vs. years), we’re more likely to feel a connection to those future events and by extension, our future selves.

~

Let’s circle back to my post from a few years ago about 300 seconds:

As a way around this — sometimes — I like to use the term “300 seconds.” Why 300 seconds? Well, 300 seconds is the same amount of time as 5 minutes. (Weird, eh?) But it sounds different, doesn’t it? Similarly, if I’m going to need more than 5 minutes, say 10 minutes, I might say 600 seconds.

To piggyback this research, I’d be interested to see results of a study that looked at our perception of time in an even smaller unit of measurement. For things like retirement and college savings, years to days makes sense, but what about for something that’s going to be happening in less than 5 years or something that will be happening in a few months?

Let’s say we’re hosting a conference in 3 months and we need to get things in order for it. Three months isn’t that far away, but thinking about it in months might not give us the necessary urgency. What if we thought about it in weeks? Twelve. Days? 90. Hours? 2160. Minutes? 129,600.

Ok, so minutes is probably too finite a measurement for this analogy, but I think you get the point. Changing the unit of measurement certainly has an effect on our perspective of future events.

ResearchBlogging.orgLewis, N., & Oyserman, D. (2015). When Does the Future Begin? Time Metrics Matter, Connecting Present and Future Selves Psychological Science, 26 (6), 816-825 DOI: 10.1177/0956797615572231

Want Better Group Performance? Try a Standing Meeting

In keeping with the theme of “standing” being better for us from earlier this week, I thought I’d tackle another journal article discussing the merits of standing. This time, the research included participants well-beyond the 2nd and 3rd grade, but still used students — university students, that is.

While the article from earlier this week focused on individual performance, this article looked at how standing can have an effect on group performance. In particular, how standing can have an effect on how we participate in groups. From the research:

Our findings suggest that, in addition to the physiological benefits of non-sedentary work designs, getting people out of their chairs at work may increase their capacity for collaborative knowledge work.

Of particular note in this field of research is the plethora of studies (or at least ideas) people have about how things can have an effect intrapersonally. That is, how to have an effect on an individual. There’s the idea of wall colour, nature, proximity to other workers, and on and on. But this study, as the researchers noted, seems to be the first that studied how standing can have an effect interpersonally.

Similar to the article from earlier this week, I’m interested in future or other applications for this research. One obvious application was noted by the researchers towards the end of the article: leaders of organizations usually have a choice over the setup of the office, so simply removing chairs in meeting rooms and opting for more of an open-space might be useful.

As I thought about this, I wondered about what it would be like for a Board of Directors to meet in a room without table and chairs. Would a Board of Directors scoff at the idea of not having a typical boardroom? I’m not sure. So then I thought, what if there were a bigger table in the middle, but the table wasn’t meant to be sat at and instead, it was meant to be stood at. If you can get past the odd grammar of the last sentence, consider the kinds of tables you might find at the “before” of any event. You know, if you go to a wedding or some sort of gala, they’ve got the “higher” tables where you can put your drink or maybe there’s food or what have you. What if there were a bigger table like that for Board Members (of people in the meeting) to congregate around? That might do the trick.

Thinking about Board Members getting together might be a bit off-track because they won’t be meeting daily as your group(s) probably will.

Nonetheless, the idea remains the same. In the “breakout” rooms in your office, maybe instead of having the prototypical table and chairs, it’s just an open room with… a whiteboard?

ResearchBlogging.orgKnight, A., & Baer, M. (2014). Get Up, Stand Up: The Effects of a Non-Sedentary Workspace on Information Elaboration and Group Performance Social Psychological and Personality Science, 5 (8), 910-917 DOI: 10.1177/1948550614538463

Stand and Deliver: We Think Better on Our Feet — Literally

Did you see the post from ScienceDaily a couple of months ago? As it turns out, we think better when we’re on our feet. Maybe more importantly though, given how much we tend to sit throughout the day, standing is a good way to change things up (and standing is actually better for us than siting).

This study looked at standing desks in the context of education. In particular, with regard to elementary school-aged children. Given the epidemic of obesity, particularly in America, it certainly seems like a good idea to try and tackle an issue at one of the roots (sitting). While we already know that as a general rule, standing is better than sitting, the researchers were interested in how this would affect the academic performance of students. The results obtained indicate that there are no adverse effects on engagement for those students who were standing. Translation: standing desks don’t negatively affect academic engagement. Wonderful!

Of course, the researchers make it clear that this applied to the sample they studied (about 300 students of 2nd-, 3rd-, and 4th-grade age, from three schools in one suburban school district), and that there’ll need to be replication. The thing that I’m most curious about moving forward is different ages. In particular, older students. I presume that there’d be similar effects found in 6th and 7th grade and for teenagers as well, but it’d be great to see this confirmed with data.

Why stop at high school, though. It’d also be great to see this for university students. I suppose you can see where I’m going with this, right?

Whenever I go to a conference or a talk somewhere, there are almost always a handful of people who can’t bear to sit through the whole thing and it’s not because of a lack of engagement from the speaker. It’s probably a combination of factors, but what if it’s also because they find that they (the audience members of the talk) can be more engaged when they’re standing in the back of the room (or off to the side)? And if, as adults, we think that we’re better engaged in what the speaker is saying when we’re standing, why don’t we also offer that same option to our kids?

ResearchBlogging.orgDornhecker, M., Blake, J., Benden, M., Zhao, H., & Wendel, M. (2015). The effect of stand-biased desks on academic engagement: an exploratory study International Journal of Health Promotion and Education, 1-10 DOI: 10.1080/14635240.2015.1029641

Big Government NOT Linked to Greater Corruption

You hear it all the time: “Big government is the problem.” “We need to reduce the size of the government if we want to eliminate corruption.” As it turns out, just because the government grows in size doesn’t mean that corruption will grow along with it.

From a journal article published last year [Emphasis added]:

This study’s findings suggest that anticorruption policy is regularly hindered by oversimplistic analyses suggesting that “government size” must be synonymous with “corruption,” and that by cutting its government a country is concomitantly reducing the opportunities for the abuse of public office. In contrast with such analyses, this study found no evidence that government size is directly associated with corruption. In fact, the findings presented here indicate that generally the reverse is true. Government size is inversely linked to the level of corruption across nations.

You read that right — the size of the government is inversely linked to the level of corruption across nations. Meaning, as the size of the government grows, the level of corruption seems to go down.

If you had to guess, what would you say would be the most effective way to reduce corruption? There’s a strong hint in the title of the journal article. From the article [Emphasis Added]:

This study’s analysis suggests that an increase in nonprofit sector size should have the greatest anticorruption effect.

This study was done on a global-scale. Here’s a list of some of the countries that were included (there were 50 in all): Argentina, Canada, Denmark, India, Japan, Mexico, Poland, Sweden, and South Korea. The study also looked at corruption at the national level.

Maybe this is a good time to clarify that one can’t actually measure corruption as it happens because by definition, corruption happens in secret. In order to get around this, proxies like “Black Market” activity are used. In this study, the researchers relied on the “Corruption Perception Index.”

~

Even with studies like this being published, I worry that folks hellbent on “drowning government in the bathtub” will continue to use corruption in the opening salvo. And when pressed to face the facts of studies like this, they’ll explain it away as not being “relevant” to the US. So, I’d really like to see a study that specifically looks at government corruption in the US. Again, I realize the limitations of taking on a research question like this, but I think it would be interesting to look at the level of corruption in local and state governments. In fact, I’m sure there’d be differences in the level of corruption when moving from state to state, but I wonder if the difference in corruption would be negligible or if we might find something substantial. More than that, I’d be interested to see if government corruption is more strongly linked to one party or the other.

ResearchBlogging.orgThemudo, N. (2014). Government Size, Nonprofit Sector Strength, and Corruption: A Cross-National Examination The American Review of Public Administration, 44 (3), 309-323 DOI: 10.1177/0275074012465791

Visualization and Sports: Accounting for Errors in Performance

There was a great article in Pacific Standard magazine last month that I really enjoyed called: “The Game Slowed Down.” It talks a great deal about visualization and sports. In reading through it, I was somewhat amazed at just how mainstream the idea of visualization has become.

“Mental rehearsal” isn’t a new idea by any stretch of the imagination, but as I think back to my brief time as an elite athlete, visualization was hardly spoken of and certainly not openly encouraged by coaches or teammates. Lucky for me that it was something my parents taught me, so I had that early exposure to it, but I certainly think I would have benefited (and my teammates would have benefited) from group sessions where we all sat down as a team and went to “practice” by closing our eyes and visualizing our successful outcomes.

On that note, there was one passage in the article that pleasantly surprised me:

During the 2014 Winter Games in Sochi, 18-year-old Shiffrin was asked if she was nervous about participating in her first Olympics. Her response was, well, these aren’t my first Olympics:

I’ve envisioned this moment for quite a while. I’ve visualized myself on the top step of the podium, and on the third step of the podium. I’ve envisioned myself crashing, because I know what mistake I (would have) made to crash, and I know I’m not going to do that in the race.

Running reps through her head—every sliver of ice on every turn, every scenario in which something didn’t go exactly right—prepared her for the biggest event of her life. When she made a mistake halfway through her second run, causing both of her skis to leave the ground—a big no-no in downhill slalom—she didn’t panic, over-correct the error, and tumble into the snow. Instead, she stretched out those vital milliseconds through practiced over-cranking, shifted her body back into the correct position, and quickly got back on track for the rest of the run.

That’s brilliant. When I used to visualize my performances, I don’t remember accounting for “errors” in my performance, but it certainly makes sense that one would want to be prepared for all scenarios and to do that, one would want to prepare for “errors” in one’s performance.

This reminds me of the study (that I can’t seem to find at the moment) about positive self-talk. Most people think that before a performance (be that sports, musical, or even a job interview), it’s best to tell one’s self that one is awesome or that one is great and that undoubtedly, they’re going to perform well. However, this study found that, instead of pumping one’s self up in this manner, it’s actually better if one asks one’s self how one is going to perform well. That is, if you’re applying for a job, instead of saying to yourself that you’re awesome and that you’re a perfect fit for the job, it’s better if you ask yourself how you’re going to get this job or how you’re going to do well in the interview to get the job. The research showed that by asking yourself these questions, it prompts your brain to come up with strategies or ways to do perform well.

Is “A” Really the Best Option or is it Just that It’s Better Than “B”: List of Biases in Judgment and Decision-Making, Part 18

The other day, someone was talking to me about my series on biases in judgment and decision-making and it made me realize that I was missing a rather important bias — the contrast effect! I’m not sure how this one slipped through the cracks, but I’m glad to be able to write about it for you today.

It’s been almost a year and a half since I wrote something for this series, so let me refresh your memory. Each week, I took a cognitive bias and explained it. I provided an example and then I offered some ways for mitigating that cognitive bias in your own life. So, without further adieu, the contrast effect.

What’s the contrast effect? Well, as with many of the biases, it’s exactly what it sounds like: an effect that occurs because of a comparison. That is, people are more likely to perceive differences that are bigger or smaller because of something they’ve seen first. This is something that is used in sales — all — the — time. If you’re shopping for a new car, the salesperson may show a series of cars that are way out of your price range and then show you one that’s just a little out of your price range. After having seen so many cars that are way out of your price range, the one that’s just a little out of your price range won’t seem that far out of your price range. The contrast effect.

That’s not to pick on folks who sell cars, it can even happen with smaller purchases, shoes, for instances. Let’s say you’re looking for a particular kind of footwear. The salesperson may show you a bunch of shoes that don’t quite fit your needs and happen to be priced rather cheaply. Then, the salesperson shows you a shoe that does fit your needs, but is quite a bit more expensive. As you’ve seen all these shoes that aren’t what you need and now you’ve finally come to one that meets you’re needs, you may ignore the price and buy the shoes.

One of my favourite examples of the contrast effect comes from Dan Ariely‘s book, Predictably Irrational:

One day while browsing the World Wide Web (obviously for work-not just wasting time), I stumbled on the following ad, on the Web site of a magazine, the Economist.

excerpt.gif

I read these offers one at a time. The first offer-the Internet subscription for $59 seemed reasonable. The second option-the $125 print subscription-seemed a bit expensive, but still reasonable.

But then I read the third option: a print and Internet subscription for $125. I read it twice before my eye ran back to the previous options. Who would want to buy the print option alone, I wondered, when both the Internet and the print subscriptions were offered for the same price? Now, the print- only option may have been a typographical error, but I suspect that the clever people at the Economist‘s London offices (and they are clever-and quite mischievous in a British sort of way) were actually manipulating me. I am pretty certain that they wanted me to skip the Internet- only option (which they assumed would be my choice, since I was reading the advertisement on the Web) and jump to the more expensive option: Internet and print.

But how could they manipulate me? I suspect it’s because the Economist‘s marketing wizards (and I could just picture them in their school ties and blazers) knew something important about human behavior: humans rarely choose things in absolute terms. We don’t have an internal value meter that tells us how much things are worth. Rather, we focus on the relative advantage of one thing over another, and estimate value accordingly. (For instance, we don’t know how much a six- cylinder car is worth, but we can assume it’s more expensive than the four- cylinder model.)

In the case of the Economist, I may not have known whether the Internet- only subscription at $59 was a better deal than the print- only option at $125. But I certainly knew that the print and-Internet option for $125 was better than the print- only option at $125. In fact, you could reasonably deduce that in the combination package, the Internet subscription is free! “It’s a bloody steal-go for it, governor!” I could almost hear them shout from the riverbanks of the Thames. And I have to admit; if I had been inclined to subscribe I probably would have taken the package deal myself. (Later, when I tested the offer on a large number of participants, the vast majority preferred the Internet- and- print deal.)

Before we movie into some of the ways for avoiding the Contrast Effect, I wanted to make it clear that sales isn’t the only place where this bias can creep up on us. Another good example is in evaluations (be they interviewing job candidates or marking term papers). If one doesn’t have a rubric by which one is scoring candidates (or papers), it can be easy to slip into the contrast effect: “Well, that candidate was much better than the last candidate, let’s put them through to the next round.” It could be that the latter candidate, while better than the first, still doesn’t meet your criteria to make it the next round, so putting them through would be wasting valuable resources — both yours and theirs.

Ways for Avoiding the Contrast Effect

1) Standardized Evaluation

In our most recent case involving interview candidates or term papers, creating a rubric or standardized method of evaluation prior to examining candidates/papers will go a long way to help one avoid falling into the trap of the contrast effect. This method could also be applied when it comes to shopping (i.e. sales). For instance, let’s say you’re looking for a car. Prior to arriving at the dealership, you could create a table for how you’re going to evaluate the cars you view while at the dealership. In this way, you can guard against the salesperson knowingly (or unknowingly) showing you cars at either end of the spectrum before showing you the cars you might actually purchase.

2) Are There Other Options?

Often times, when we’re succumbing to the contrast effect, we’re looking at option A versus option B. This is why it’s so important to have some sort of standardized evaluation (see #1), but short of a standardized evaluation, it’s important to remember that almost never are those two options your only two options. “Should I get this car or that car?” Well actually, you have another option — neither of those cars. And another option, you could consider buying a bike or maybe taking public transportation. Whenever you find yourself faced with a decision between two options, it can be useful to consider other options, just in case you’ve fallen into the trap of the contrast effect.

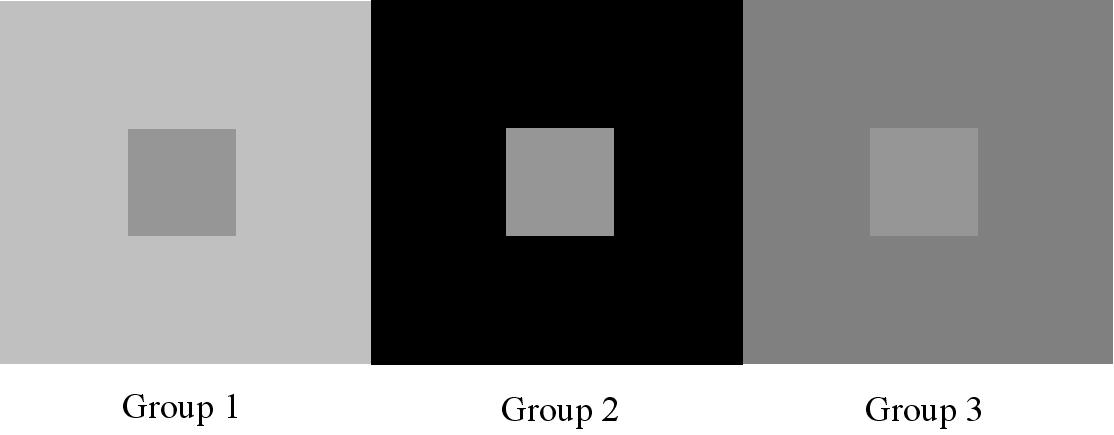
Note: the images in this post are all examples of the contrast effect.

If you liked this post, you might like one of the other posts in this series:

The Science of Us: Hank Green’s Crash Course in Anatomy and Physiology

As a professor, it’s probably not surprising that I like to learn. Even though I’ve completed a few degrees, I still try to make time to learn new things — daily. In fact, I’ve even shared these learning experiences. There was the Harvard University’s course on Justice with Professor Michael Sandel (I also went through one of his books chapter by chapter), there was my series on cognitive biases, there was MRUniversity’s course in economics, and before all of that, there was Crash Course.

This was probably one of the first video series that I came across that I felt like I actually learned (and remembered!) something 20 minutes after the video finished. I first went through John Green’s (the same John Green who wrote The Fault in Our Stars) crash course in world history. Later that year, John’s brother, Hank, did a crash course in ecology. John also did a crash course in literature. I didn’t realize it, but Hank also went on to do a crash course in psychology.

There are more crash courses than what I’ve just shared, but those are just a few to give you a taste. Anyway, the reason I’m writing today’s post is because I just learned that Hank is doing a crash course in anatomy and physiology.

Anatomy and physiology are two subjects that I’ve always wished that I spent more time with. In fact, they’re two subjects that I think we all should have spent some time with when we were younger. I used to have the idea that it seemed like a good idea if as part of our basic education, we learned anatomy and physiology and not as some form of “punishment” (as I understand some people don’t necessarily like these subjects), but because anatomy and physiology is/are us. Anatomy and physiology are the reason that you’re alive right now. This seems an appropriate reason to try and understand it.

More specifically, ‘anatomy is the study of the structure and relationships between body parts and physiology is the science of how those parts come together to function.’ Hank calls it, “The Science of Us.”

I’m not going into this expecting to remember every minute detail, but I am expecting that I will have a better understanding of how some of the parts of the body come together to function to make me, me! As an example, I was speaking with a massage therapist the other day and she told me that massage therapists often have to translate what their clients tell them. For instance, a client will often come in complaining that they want to work on their shoulder, while reaching for the area immediately adjacent to their neck. As it turns out, our shoulder is actually far closer to the place where our arm connects to our body. The place that this person was pointing to was, in fact, their neck.

The Problem with Big Data: Lies, Damn Lies, and Statistics

I’ve used the subtitle in a previous post and I think the application to the content of this post also makes it worthwhile to use again. I was reading a post from Tim Ferriss the other day and it made me think of statistics. The post is about alternative medicine, but understanding that isn’t entirely necessary for the point I’m making. Here’s some context:

Imagine you catch a cold or get the flu. It’s going to get worse and worse, then better and better until you are back to normal. The severity of symptoms, as is true with many injuries, will probably look something like a bell curve.

The bottom flat line, representing normalcy, is the mean. When are you most likely to try the quackiest shit you can get your hands on? That miracle duck extract Aunt Susie swears by? The crystals your roommate uses to open his heart chakra? Naturally, when your symptoms are the worst and nothing seems to help. This is the very top of the bell curve, at the peak of the roller coaster before you head back down. Naturally heading back down is regression toward the mean.

If you are a fallible human, as we all are, you might misattribute getting better to the duck extract, but it was just coincidental timing.

The body had healed itself, as could be predicted from the bell curve–like timeline of symptoms. Mistaking correlation for causation is very common, even among smart people.

And the important part of the quote [Emphasis Added]:

In the world of “big data,” this mistake will become even more common, particularly if researchers seek to “let the data speak for themselves” rather than test hypotheses.

Spurious connections galore–that’s what the data will say, among other things.  Caveat emptor.

This analogy reminded me of the first time I learned about correlation and causation in my first psychology class as an undergraduate. It had to do with ice cream, hot summer days, and swimming pools. In fact, here’s a quick summary from wiki:

An example of a spurious relationship can be illuminated by examining a city’s ice cream sales. These sales are highest when the rate of drownings in city swimming pools is highest. To allege that ice cream sales cause drowning, or vice-versa, would be to imply a spurious relationship between the two. In reality, a heat wave may have caused both. The heat wave is an example of a hidden or unseen variable, also known as a confounding variable.

Getting back to what Ferriss was saying near the end of his quote: as “Big Data” grows in popularity (and use), there may be an increased likelihood of making errors in the form of spurious relationships. One way to mitigate this error is education. That is, if the people who are handling Big Data know and understand things like correlation vs. causation and spurious relationships, these errors may be less likely to occur.

I suppose it’s also possible that some, knowing about these kinds of errors and how little the average person might know when it comes to statistics, could maliciously report statistics based on numbers. I’d like to think that people aren’t doing this and it just has more to do with confirmation bias.

Regardless, one way to guard against this inaccurate reporting would be to use hypotheses. That is, before you look at the data, make a prediction about what you’ll find in the data. It’s certainly not going to solve all the issues, but it’ll go a long way towards doing so.

How You Probably Discriminate and Don’t Even Know It

Are you a part of a group at work, school, or recreationally? Well, then you’ve probably discriminated without even knowing it. A recent theoretical review of the literature concluded “ingroup favouritism is more potent than outgroup hostility” when it comes to discrimination in the United States. Meaning, preferential treatment to the people that are on your team contributes to discrimination more than outward displays of hostility to people not part of your team.

I should say that this ingroup favouritism doesn’t simply apply to overt teams/groups. Consider your work relationships for a moment. Let’s say that your son or daughter gets along quite well with the son or daughter of one of your subordinates. This particular subordinate missed a bunch of days of work this year because they were taking care of their child who was sick. When it comes time for performance reviews and this particular subordinate’s performance falls between two possible ratings, you give the subordinate a higher rating. However, there is another subordinate, without a child who’s friends with your child. This subordinate has also missed some work this year, but instead of giving them the higher rating, you give them the lower (of the two) ratings. By giving a higher rating to the subordinate to whom there is a connection, you’d be exhibiting ingroup favouritism. You’re not openly discriminating against the other subordinate, but you are showing preferential treatment (even if it’s inadvertently!) to one subordinate over the other.

This particular bit of research seemed especially important given Ta-Nehisi Coates’ recent essay in The Atlantic. As I grew up in a fairly multicultural environment, I like to think that I don’t let a person’s race or ethnicity factor into any decisions I make. However, I, as many others have learned from Harvard’s Project Implicit Test, the culture that I live in has had an important influence on me.

~~

There are obvious streams for this kind of research, but I was thinking about it in a broader context. As it stands, there’s the idea of ingroup and outgroup. That is, “our people” are over here and I’m going to do everything I can for them, while you’re people are over there and I’m not going to necessarily do everything that I can to help them. What if there no longer was an ingroup and an outgroup? Or maybe more specifically, what if everyone was part of your ingroup?

Consider someone like the Dalai Lama. There’s the ‘obvious’ ingroups for the Dalai Lama (Tibet, Buddhism, etc.), but I’d bet that the Dalai Lama probably thinks of all humans as his ingroup. Of course, we can’t all be the Dalai Lama, but we certainly could strive for this.

Let’s simplify this example just a little bit. Americans — is an ingroup — when you put it in context of a global stage. Americans look at themselves as an ingroup when it comes to some sort of international competition. That is, at the upcoming World Cup in June, Americans will be an ingroup, especially when there are matches against other countries. What if, instead of Americans thinking of themselves as the ingroup, they, instead, thought of the ingroup as fans of soccer (or football, depending upon where you’re from — although most Americans probably say soccer). While this is still an ‘ingroup,’ it’s certainly a broader and bigger ingroup than simply American (fans of soccer).

While not perfect, this is also on the way to expanding the ingroup to all of humanity.

ResearchBlogging.orgGreenwald AG, & Pettigrew TF (2014). With Malice Toward None and Charity for Some: Ingroup Favoritism Enables Discrimination. The American psychologist PMID: 24661244

Do Public Salaries Increase Performance?

With the recent news regarding Jill Abramson and the New York Times, I wanted to take a closer look at the academic literature to see if I could find something about public salaries. There’s certainly been a lot written about whether she was fired or she quit or whether it had to do with secretive salaries or her gender. I’m not writing this post to debate any of that because I consider myself grossly uninformed on what may or may not have happened, but I am writing this post to talk about pay secrecy.

The research showed that pay secrecy adversely affected individual task performance. Meaning, the absence of public salaries led to a worse performance. Why? Pay for performance. That is, because the salaries weren’t public, workers didn’t have a perception that an increase in performance would lead to better pay.

There were a couple other important pieces that I wanted to highlight.

1. The best workers were more sensitive when it came to the perception of link between pay and performance.

This certainly makes sense as those folks who are working the ‘hardest’ would want to know that they’re being appropriately compensated for their hard work. An implication from this point is that organizations that don’t have public salaries might have a harder time retaining their top talent. We can tie this back to the situation between the New York Times and Abramson. Again, I wouldn’t say I’m informed of the situation, but from what I understand, Abramson was rather high up in the NYT hierarchy, which indicates to me that it was fair to consider her “top talent.”

2. If public salaries isn’t an option, partial pay openness could mitigate the negative effects of pay secrecy.

It might be that a firm or organization isn’t yet comfortable with releasing all data about salaries, so an intermediary step could see them gently open up the salaries by talking about ranges. This point reminded me about government salaries that often have ranges for each level that an employee reaches. One may not know exactly what their co-worker makes, but if one knows that their co-worker has reached a certain level, one would know that one’s co-worker’s salary is in a certain range.

Just before ending this post, I wanted to circle back to the point about pay for performance. In this study, the task that participants completed was a “computer matching game.” Based on what’s been written about pay for performance, this is the right kind of task to test these sorts of hypotheses. However, when it comes to more creative tasks, the pay for performance model doesn’t always fit the best. Tying this back to the situation with Abramson and the NYT — it’s not clear to me whether the “pay for performance” model fits best. Having never worked at a newspaper or publishing outlet, I don’t exactly know the role of an Executive Editor, but from what I’ve been able to read through Google searches, it sounds more like creative tasks.

ResearchBlogging.orgBelogolovsky, E., & Bamberger, P. (2014). Signaling in secret: Pay for performance and the incentive and sorting effects of pay secrecy Academy of Management Journal DOI: 10.5465/amj.2012.0937